In our previous posts of the B2B KPIs series, we have already talked about customer retention & churn rates and customer lifetime value, today we are shifting our focus from customers to potential customers. We will talk about the KPIs that help evaluate how smoothly the journey from a lead to a customer flows in businesses’ lead funnels.
Usually for a traditional eCommerce business, the most effective way of measuring the quality of the client base is considered to be an RFM (recency, frequency, monetary value) analysis. But it gets tricky with B2B eCommerce, as the complexity of engaging a new client is much higher and the ordering cadence of a B2B client makes it difficult to correctly identify best clients at early stages. That is why it is important to get more granular in the analysis of the whole new prospects engagement pipeline. So, besides good old RFM analysis, we think it is very important to track classical B2B KPIs like Amount of Leads Generated, MQL to SQL Conversion Rate, Sales Leads to Close Ratio, and the Average Sales Cycle.
Lead Funnel Performance: What Is It All About?
In today’s ultra-competitive and crowded marketplace, capturing and nurturing interested prospects, or leads, along the sales funnel has been the biggest challenge for B2B companies. The amount of leads you generate increases the odds of actual sales and revenue growth. However, the fact that you’ve captured a substantial amount of leads is only a prerequisite for successful lead conversions. It’s not solely lead volume that matters, it is rather lead quality that offers the most strategic benefit. As the B2B Lead Generation Report delivers, 68% of B2B experts are well aware of this fact, as they cite increasing the quality (not quantity!) of leads a top priority for their businesses.
Since leads are so promising, tracking them through respective sales KPIs is essential because it enables you to evaluate whether your targeting proves its worth, to forecast total sales volume, and to compute the ROI of every related marketing or sales campaign.
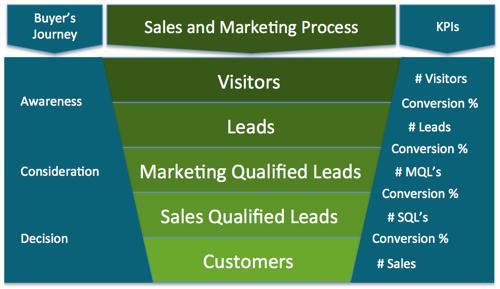
Lead conversion funnel. Image credit – Business2community.com
Let’s take a closer look at a few lead funnel performance related sales KPIs that B2B eCommerce companies should track.
Amount of Leads Generated
These days, getting more leads instead of hiring more sales experts proves to be a sales growth prerequisite. As the title of this metric suggests, the Amount of Leads Generated shows the total of new leads that have been created over a certain period of time. Important note here is, however, that when analysed alone as is, this metric provides very basic and crude information your company should not entirely rely on. However, the Amount of Leads Generated KPI is a key to the aggregate picture as it is used to demonstrate the lead traffic sources efficiency, reveal performance level of particular company’s departments, and help to identify potential of certain locations, products or services.
MQL to SQL Conversion Rate
Marketing Qualified Leads (MQLs) and Sales Qualified Leads (SQLs) are two coherent stages within your sales funnel. To get a clear view of the sales funnel and spot potential bottlenecks at early stages, you should understand how these distinguish. The MQL is normally the next stage following the initial inquiry. It labels prospects who have expressed interest in company’s products or services by requesting demos, downloading guides and overall reacting to various calls to action. These leads are qualified for further marketing outreach. The SQLs are a logical evolutionary phase of a lead: the prospect has been vetted and a project with an actual purchase decision is identified. Typically the leads get into one’s CRM or database as MQLs and then get converted into SQLs, as a result of lead nurturing campaigns or targeted sales outreach, rarely do they get created straight as the Sales Qualified Leads.

The MQL to SQL Conversion Rate metric displays the ratio of marketing qualified leads actually converted into sales qualified leads. With the help of this sales KPI, you can evaluate both the quantity and quality of the leads passed from marketing to sales reps offering a more granular view of the sales pipeline.
The formula of MQL to SQL conversion rate calculation is straightforward:
(Amount of the Sales Qualified Leads / Amount of the Marketing Qualified Leads) x 100
Industry average MQL to SQL ratio is considered to be 26%.
Sales Leads to Close Ratio
This metric gauges the amount of leads that turn into actual sales. Thus, this tracks the general effectiveness of your sales team. In addition, the Sales Leads to Close Ratio can serve as a performance indicator for sales individuals you’d like to monitor since it measures the percentage of sales leads converted to actual profit for the business. Besides, analyzing this KPI allows to determine what is more important at the moment: (1) generating new leads or (2) fostering already existing prospects from the pipeline to close.
Use the following formula to calculate the Sales Leads to Close Ratio:
(Amount of Sales Leads over a certain period of time / Amount of Closed Sales over the same time) x 100
Industry average Sales leads to Close ratio is considered to be 22%.
When tracking this KPI, keep in mind that it may be changing over time depending on your typical sales cycle. So be sure to recalculate this ratio for a couple of different time frames and define the one that is more relevant to your business and stick to it in further reports.
Average Sales Cycle Length
The Average Sales Cycle Length allows you to estimate how long it takes to win a deal starting from the very first interaction with a prospect. You should use this KPI to make sales forecasts more plausible, be able to roughly plan your sales based on the number of SQLs, and to get a deeper insight into lead funnel performance for more accurate customer decision-making motivators and behavior predictability.
This metric gives you a benchmark to start from and as you improve all the intermediary steps involved in a sales pipeline (i.e. lead nurturing, response time, etc.), your average sales cycle should start lowering and facilitate a faster revenue growth.
On top of that, Average Sales Cycle Length is an important metric for management to track business viability. Longer sales cycles mean that a strong pipeline is required to ensure business viability and cash flow. This is not only a metric for sales but also marketing experts because it takes into consideration the whole sales and marketing funnel.
To calculate the Average Sales Cycle Length, use this formula:
(Number of days from first contact + Customer conversion for all deals) / Number of deals
B2B industry average sales cycle length is known to be 102 days.
How Tracking KPIs for Sales Helps the Bottomline
Analyzing and tracking leads-related indicators among other KPIs for your company will be of a great help when analyzing the current state of affairs for your business. These metrics help detect bottlenecks within the sales funnel that can be optimized by revisiting marketing and sales strategies. Over time, you can analyze these lead funnel performance metrics again to verify whether new strategies have proved successful.
If you haven’t already, check out our post on customer retention metrics and B2B customer churn. If you’re planning a B2B marketplace, make sure to learn about various online B2B marketplace metrics. Stay tuned for the final part of our B2B KPI series that will be covering cost per acquisition metrics.