TCO calculator
See What Build vs. Buy Will Cost Over 5 Years
Thinking about building your B2B eCommerce application instead of buying?
Put your own assumptions into the model and compare the 5-year total cost
of an in-house build with a purchased and customized platform.
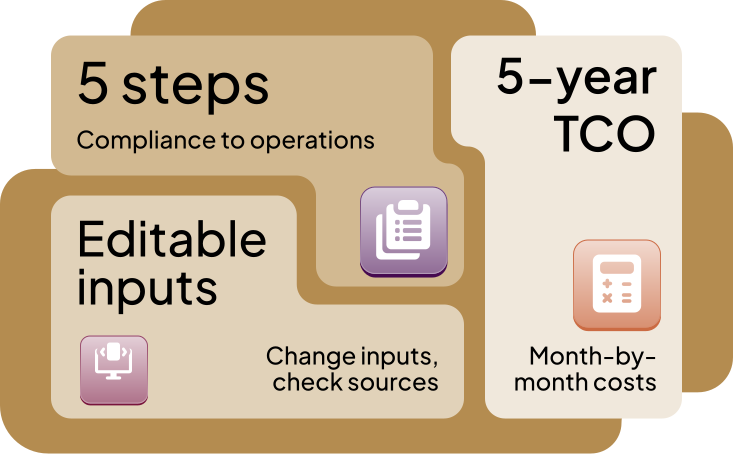
The shaded fields are yours to fill in. They are the ones only you can answer — how much you need built, what your developers cost, what the licence quote says. Start there.
Everything else is already filled in and shown in grey. You can change any of it, and you should if you disagree. Each of those figures is based on or derived from credible research and OroCommerce’s own experience, with sources linked under the fields that use them.
Everything else is already filled in and shown in grey. You can change any of it, and you should if you disagree. Each of those figures is based on or derived from credible research and OroCommerce’s own experience, with sources linked under the fields that use them.
Every figure, both ways
Build
Buy
1. Security and compliance
No AI impactOnly the costs that differ. Your own SOC 2 or ISO 27001 audit is excluded: the fee is the same either way.
Included in the licence
To go live, one-time ?$25 000$0
Per year, ongoing ?$36 600$7 200
2. Architecture and integration design
Low AI impactCore architecture is what a platform already decided for you. Integration design is yours either way. Neither accelerates well.
Included in the licence
↪Design effort after acceleration ?927 h252 h
Core architecture, to go live ?$60 750—
Integration design, to go live ?$22 680$22 680
3. Custom development
High AI impactEnter hours as you would estimate them for conventional development. Acceleration is applied by the model, so don't discount them yourself.
↪Development effort after acceleration ?4 000 h500 h
To go live ?$360 000$45 000
Per year at this burn rate ?$220 435$64 893
4. Review, debugging and QA
Moderate AI impactDerived from the coding hours above, since writing code faster does not make there be less of it to test.
↪Testing and QA derived from coding ?2 800 h350 h
↪Review and QA effort after the uplift ?3 304 h413 h
This setting feeds two multipliers used further down, in Operations. At 60% review it sets a 1.15× debt multiplier on all work against your own code, and a 1.00× multiplier on audit evidence hours. Merge on a green build instead and those become 3.00× and 1.50×. Nothing is charged here — thorough review costs more now and less later. Modelled, not measured.
To go live ?$297 360$37 170
5. Operations
Low AI impactSalaries, tooling, hosting, licence and the cost of keeping your own code working.
↪Token spend to reach launch ?$12 000$1 500
↪Token spend a year once live ?$3 864$1 690
↪Implied AI spend per developer a month ?$354$180
↪Code you own and maintain ?$720 000$90 000
↪Ownership hours a year ?828 h103 h
↪Enhancement hours a year ?460 h460 h
↪Total upkeep hours a year ?1 288 h563 h
Per year once live ?$183 084$139 606
— ownership tax on your own code$74 520$9 315
— enhancement budget$41 400$41 400
— licence and hosting ?$24 000$80 000
— AI seats and tokens$6 564$1 690
Licence and hosting paid before launch ?$39 195$55 476
Seats and tokens during build ?$20 819$1 500
Your result
Both paths priced with the numbers you entered. Step back through any section to change them — this updates as you go.
Build your own
Per year once live
$183k
To go live
$826k
Buy and customize
Per year once live
$140k
To go live
$162k
Annual difference?
+$43k
more to run building your own, every year
Crossover?
none
no crossover within 10 years
Go live?
20 mo vs 8 mo
build vs buy, at 140 h per developer a month
Blended acceleration?
30% vs 29%
across all work, build vs buy
Buy has no dedicated developers set, so its go-live is calculated as if one person were on it.
Chart window
Show
Build your own (dashed)
Buy and customize (solid)
go live
Total spent to date. Each line climbs steeply while the platform is being built, then rises at the slower rate of running it.
Step 4 of 6 — Review and QA
*Notes and sources — click to see assumptions, caveats and links
1. What this compares. These are comparison figures, not complete budgets. Nothing here values revenue from launching earlier; the gap between the go-live markers is where that matters most.
2. Coding acceleration, 60%. Applies to coding only, and to that phase in isolation rather than to net delivery time. METR measured 16 experienced developers on 246 real tasks taking 19% longer with AI while estimating they were 20% faster. METR labels that result historical and published follow-up data on late-2025 tools in February 2026; this figure should be rechecked against it.
3. Review uplift, 60% of the code-review share. Published figures point the same way but measure cycle time rather than labour: Faros AI, 1,255 teams found review time per pull request up 91% while pull requests grew 154% larger, which implies effort per line fell. Faros and LinearB, 22,000 developers found median review time up 441%, mostly queue latency. CodeRabbit reports 1.7× more issues per AI pull request, which does imply more rework.
4. Testing at 35 hours per 100 hours of coding. A planning ratio, not a measurement. Logged effort on real platform work often runs higher: QA can absorb more recorded time than development once acceptance cycles and defect rework are counted.
5. Upkeep split into two rates. The Lientz and Swanson breakdown puts roughly half of maintenance in perfective work and the rest in adaptive, corrective and preventive. Only the second scales with how much code you own. The same study found measured corrective work running two to three times the original survey figure, so the split is not settled. Enhancement is applied equally to both paths, so it does not affect the difference between them. Lehman and aging-debt research imply the same feature costs more in a larger codebase; no premium is applied because no measured magnitude exists.
6. Debt and audit-evidence multipliers. Derived from the review-effort figure: thorough review costs more now and less later. Modelled, not measured. Clean maintenance-side data on AI-assisted codebases will not exist for another year or two.
7. Token spend. Tied to hours of code written rather than headcount, and it continues after launch on maintenance work. DX, 400+ organisations put seat plus token spend at $200–600 per developer a month; the interim line under the rate shows what your inputs imply, as a cross-check. The daily figure is Anthropic's published enterprise average; the hourly conversion is ours. Verify the live figure — it moved from $6 to $13 per active day in April 2026, and reported spend ranges from under a dollar a session to $500–$2,000 a month for heavy agentic work.
8. PCI DSS on the buy side. Treated as covered by the licence. That holds while payment capture stays inside what the vendor ships and certifies. Heavily customise the checkout and scope can move back to you — a higher-tier self-assessment, quarterly scanning, your own attestation — at a cost this calculator does not show.
9. Timing. Recurring costs start at go-live, not at project start. Licence and hosting are the exceptions and accrue from month zero. Upkeep is charged on the code you wrote, not on architecture or testing effort. Calendar time assumes 140 productive hours per developer per month, which moves go-live dates but never cost.
10. What the acceleration figure does not claim. It applies to the coding phase, not to overall delivery. DX, 400+ organisations measured a median pull-request throughput gain of 7.76% and a mean of 13.1%, with most organisations between 5% and 15%. Coding is only about 14% of a developer’s day per Microsoft research, so large gains on that slice move total throughput far less. The blended figure this calculator reports is effort on project work, which is a narrower measure than either.
11. Costs excluded because they fall on both paths. Codebase indexing, compliance infrastructure and enablement training typically add $50,000–250,000 a year at enterprise scale, and onboarding runs 4–8 hours per engineer in the first quarter. Both are organisation-level and land on either path, so they are outside this comparison and outside these totals.
12. Why the review default is not conservative. After AI-generated code contributed to outages in early 2026 — one costing roughly 120,000 orders — Amazon ran a 90-day safety reset with mandatory two-person code review and audits across 335 Tier-1 systems. The review uplift here reflects that kind of practice rather than an optional extra.
13. Projections. The crossover search runs to ten years with every cost held flat, which no real cost is. Read anything far beyond your window as a direction, not a date.
A practical alternative
Get full control to customize without building it from scratch
A practical alternative
Get full control to customize without building it from scratch
A custom build is not the only way to get the B2B capabilities your business needs. OroCommerce covers capabilities such as account hierarchies, customer-specific pricing, RFQs, order workflows, and ERP integrations, while making it easy to build on top of it or tweak existing functionality to your liking.
Share your calculator results with us and we’ll talk through the numbers, the assumptions, and whether OroCommerce is right for your project.
Companies Building on OroCommerce

Speed was our primary requirement, but we couldn't sacrifice B2B depth. OroCommerce gave us the flexibility of an enterprise build with the speed of a modern SaaS platform. We were able to stand up a pilot, validate our direct-to-consumer strategy, and scale it across our network faster than would have been possible with traditional legacy commerce suites.


We looked at a lot of platforms, but nothing felt quite right. When we found OroCommerce and saw the product in action, it was like the fog lifted. Everything started to make sense: the vision, the flexibility, the unified B2B-first approach. We could clearly see our digital commerce roadmap coming to life, not just for today, but for years down the line.


Whenever we launch a new brand or sub-site, the question isn’t ‘Why use Oro?’, it’s ‘Why not?’ And we’ve never found a reason not to.


In Oro, we found a platform and a partner that [...] provides us not only with native features and capabilities necessary to launch a B2B marketplace but also with the flexibility to keep on iterating and improving our offering further.


With OroCommerce, we can now offer sales order information and shipment tracking in real time, and reduce non-value added work for both our clients an our inside sales teams.


The true test of a platform is how it performs in year five, not year one. What keeps us on OroCommerce is that we never felt locked into a legacy decision. Instead of hitting a technical wall, the platform grew with us, handling every new layer of complexity we threw at it.

The OroCommerce platform has been a major lever in achieving our B2B eCommerce development goals. The flexibility and robustness of the OroCommerce platform have helped us meet the demands of our various markets.


I did extensive research, but once I found Oro, the decision was quick. There just aren’t many platforms honing in on B2B so precisely. We made a really good long-term decision with Oro.


Oro is a good foundation to build out whatever we need on our eCommerce site. PetraCentral™ has the convenience of consumer ecommerce sites but is specially designed to suit the unique needs of our customers’ businesses.


We leaned heavily on OroCommerce’s comprehensive native B2B features, which enabled the rollout of a high-quality, mission-appropriate backend and frontend deployment with very little need for customization now or in future.


OroCommerce has the most robust feature set for the B2B back-end and offers the best B2C customer experience on the front-end.